Insights
Media buzz from Taylor Swift’s tour is a “Love Story” for consumer discretionary stocks

Our artificial intelligence (AI)-based sentiment factor, derived from hundreds of thousands of media sources, shows that Eras tour coverage gave the sector a boost over consumer staples.
October 2024
Musa Amadeus
Quantitative researcher, MKT MediaStats, LLC
Will Kinlaw
Senior managing director and head of Research, State Street Global Markets
Michael Metcalfe
Head of Macro Strategy Research, State Street Global Markets
Gideon Ozik
CEO of MKT MediaStats, LLC, affiliate professor, EDHEC Business School, and academic partner, State Street Associates
Ronnie Sadka
Haub Family Professor, Seidner Department of Finance Chairperson, Senior Associate Dean of Faculty, Boston College, and academic partner, State Street Associates
Step aside, John B. Taylor, there’s a new Taylor Rule in town. The original rule, named for the economist who created it in 1993, is a guideline for how central banks like the United States Federal Reserve should adjust interest rates in response to changes in economic conditions. The new rule, which we formulated just this week, provides a framework to quantify the potential impact of Taylor Swift’s upcoming tour on the US equity market. We’ll give you one guess as to which one attracts more interest at dinner parties.
Here’s the bottom line: The media frenzy surrounding the Eras tour brought more than just hits to stadiums; it also struck a chord with consumer discretionary stocks – think tickets, merchandise and travel – providing a boost to the sector’s market capitalization relative to its more conservative cousin, consumer staples.
Imagine consumers choosing concert tickets over their grocery list, and you will start to get the picture. What’s fascinating is that even after controlling for broader market factors and economic sentiment, we observe a statistically significant association between positive mentions of Taylor Swift’s tour in an economic context and a favorable shift in consumer stocks. If the same effect prevails during her upcoming tour, which starts October 18, we’d expect consumer stocks to benefit again, all else equal.
But let’s start from the beginning. For more than a decade, State Street Global Markets and MKT MediaStats, LLC, have partnered to develop a comprehensive suite of AI-based, quantitative indicators that track media sentiment for thousands of stocks, currencies and other major indexes. We can even track sentiment related to key investing themes such as election outcomes, recessions, China’s economic growth, or trade tensions.
Every day, our algorithms scan hundreds of thousands of sources and millions of social media posts around the world. Using its proprietary technology, MediaStats measures three things: 1) The intensity (volume) of coverage, 2) The tone (sentiment) of coverage, and 3) The dispersion in tone across sources. Imagine a chart showing the volume of media coverage for the hottest semiconductor company or meme stock and a second chart showing whether that coverage was trending positive or negative in tone.
Why is this relevant? The technology synthesizes vast quantities of unstructured media data to produce precise measurements of coverage that help investors identify shifts and inflection points in sentiment as they occur. This provides insight into the scarcest and most important resources investors have: Their attention. If we know what themes and narratives investors as a whole are tuned in to, and we know which assets are affected by their collective attention, it can give us an idea of what investors are going to buy or sell. That can help us get ahead of market moves.
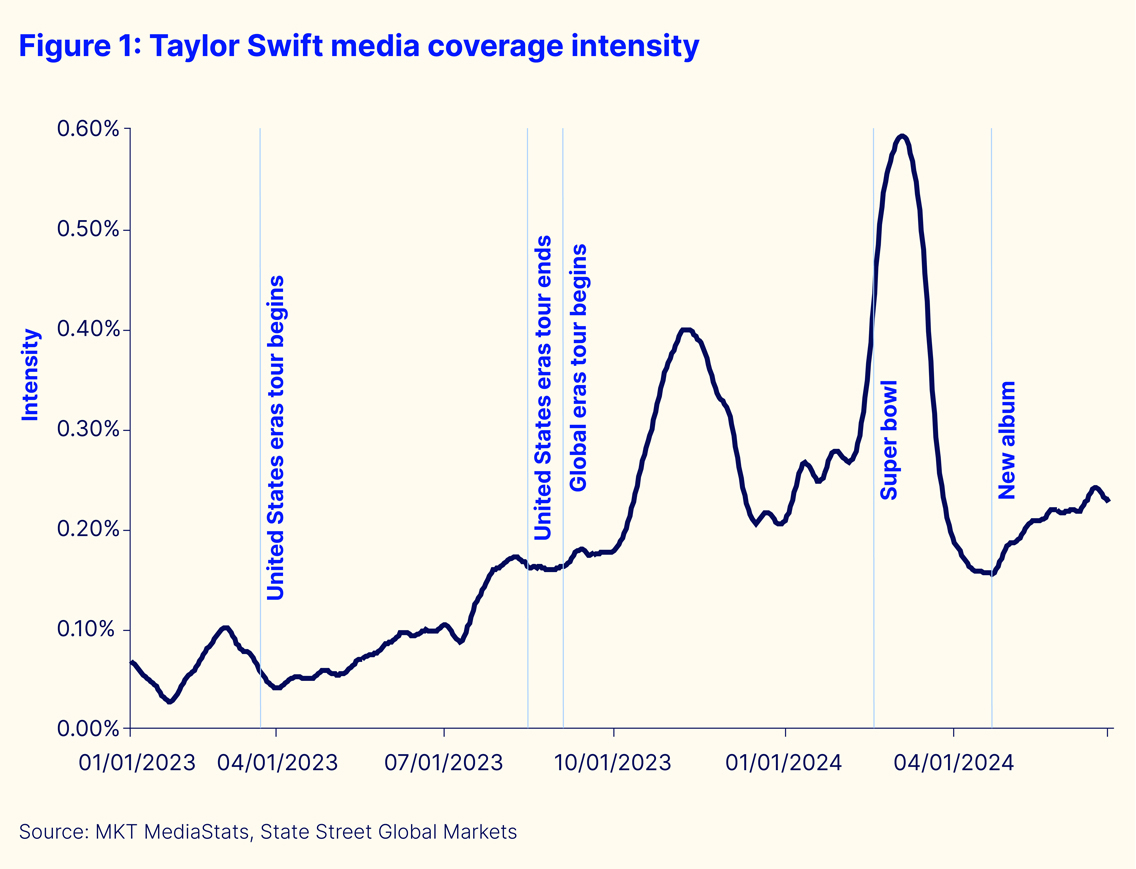
Figure 1 shows the intensity indicator for general media coverage of Taylor Swift. Specifically, the vertical axis of the chart reflects the proportion of articles in the full reservoir that are related to the singer. Whether it’s her chart-topping albums, sold-out tours, or her appearance at the Super Bowl, the spikes reflect moments when she has been a media focal point. These bursts of attention reinforce what you knew already: Swift is a pop culture juggernaut. What you might not have known is that she has had a quantifiable impact on the stock market, and that’s where we’ll focus next.
Now we narrow our focus to how Swift is discussed in an economic context. Figure 2 captures only positively toned mentions where Swift’s financial or economic contributions are highlighted – examples might be record-breaking ticket sales, the boost to local economies around concert venues, or the massive uptick in tourism associated with her performances. What’s notable here is how positive attention spikes significantly during her major tours, suggesting that her economic impact resonates well beyond music fans.
There are some fascinating differences between the two charts. Whereas general coverage of Swift rose throughout 2023 as the tour progressed, the narrative around its economic impact didn’t pick up in earnest until late 2023 as the US tour was drawing to a close. By the time the global tour started, the world had caught on to the fact that there was a major economic story here. In the chart, we see that both general coverage and positive economic coverage spike in tandem during the autumn.

This brings us to the heart of our analysis. Figure 3 demonstrates the statistical association between Swift’s positive economic sentiment (as seen in Figure 2) and the performance spread between consumer discretionary stocks and consumer staples stocks, which we measure using their respective S&P 500 sector indices.
To simplify: Consumer discretionary stocks represent companies whose products are non-essential but desirable – luxury goods, entertainment or dining out – while consumer staples represent necessary, everyday products like food and household items. When people feel confident and optimistic about the economy, they tend to spend more on discretionary items, whereas in times of uncertainty, they stick to the essentials. For this reason, consumer discretionary stocks are often referred to as “cyclical stocks” because they are sensitive to the business cycle whereas consumer staples are “non-cyclical” because they’re more resilient to economic gyrations.
What we observe from the quantitative analysis in Figure 3 is that there is a positive association between the discretionary-staples performance spread and the Taylor Swift economic narrative. Moreover, we can say with 95 percent confidence that this result is not a random statistical fluke. But we didn’t stop there: We also did some robustness checking to ensure that we were actually capturing a Taylor Swift narrative, and not a broader economic narrative in the media. We removed economic release dates from the analysis to ensure they weren’t driving the result. The numbers hold up to this scrutiny.
For our quantitatively inclined readers: We regress the weekly consumer discretionary-minus-staples return spread on the weekly changes in the Swift economic narrative series (and S&P 500 weekly return) using data from mid-June 2023 through mid-June 2024 (52 weeks). This is our base model, which has a Swift narrative beta coefficient of about 50 basis points and a t-statistic greater than two. That is, a one-standard deviation change in the weekly Swift economic positive intensity series corresponds to a 50 basis-point weekly return spread of consumer discretionary-minus-staples. To pressure test the analysis, we also orthogonalize the Swift variable against broader economic sentiment variables for the economy, consumption, US growth and general economic growth. We then re-run our analysis using the orthogonalized Swift series. Our results are robust to these controls.

The r-squared values in Figure 4 give us another lens into this relationship. When we run the analysis using the S&P 500 (i.e., the market) alone, it explains about 28 percent of variation in the consumer discretionary-minus-staples return spread. When we add the Swift narrative factor, the model explains about 5 percent more variation, a non-trivial increase for financial markets analysis, especially when using a non-price-based factor.

Another way to quantify the economic impact is by measuring the capital appreciation in the consumer discretionary sector and depreciation in consumer staples in response to a one-standard deviation change in the Swift narrative factor. Figure 5 shows that for consumer discretionary stocks, a coefficient of +0.32 percent and a market capitalization of US$4.9 trillion translates to a gain of US$16 billion. For consumer staples, a coefficient of -0.20 percent and a market capitalization of US$3.3 trillion results in a market capitalization loss of US$7 billion. Together, this suggests that an increase in the “Swiftonomics” narrative could be associated with a market valuation shift more than US$12 billion.

So what does it all mean? Neither we nor our lawyers, not even in our “Wildest Dreams,” would recommend that an investor use this report as the sole basis for an investment decision. See what we did there? But we do draw three conclusions from the analysis.
First, what we’ve discovered is more than just a lighthearted take on the relationship between Taylor Swift and the stock market – it’s a window into how consumer confidence and sentiment can be influenced by cultural events and figures. More important to investors, it’s also a great case study on how media narratives – the topics that attract investor attention – can move financial markets. This notion is not new: Robert Shiller, the famed Yale professor who won the Nobel prize in economics for his contributions to behavioral economics, has focused much of his recent research attention on the importance of narratives. What is new is the emergence of large language models and related technology that enable us to identify, measure and monitor narratives in real time as they emerge.
Second, the analysis does suggest that if Swift’s upcoming tour receives a burst of positive coverage, similar to the prior rounds (roughly two standard deviations), consumer discretionary stocks might get a US$32 billion boost in market cap relative to consumer staples stocks, which might stand to lose US$14 billion in market valuation, all else equal.
Third, with regard to dinner parties, we conclude that Oscar Wilde was correct when he wrote in The Picture of Dorian Gray that “When bankers get together for dinner, they discuss art. When artists get together for dinner, they discuss money.” The first half, at least, is evidently true. Guilty, Oscar. Guilty.


